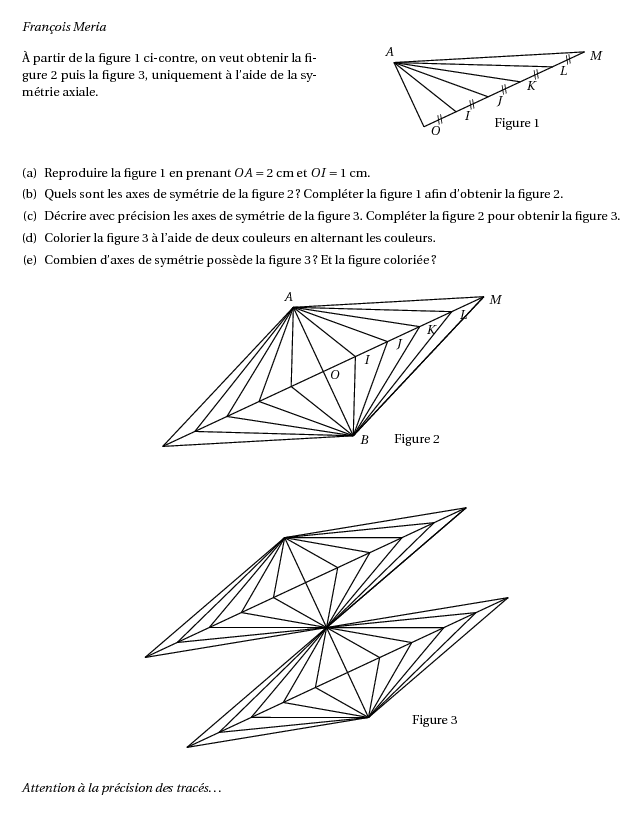
%@Auteur: François Meria\par
\begin{multicols}{2}
À partir de la figure 1 ci-contre, on veut obtenir la figure 2
puis la figure 3, uniquement à l'aide de la symétrie axiale.
\begin{center}
    \psset{unit=1cm}
        \pspicture(-2,-0.5)(5,2.2)
            \rput{25}{
            \pstGeonode[PointSymbol=none,PosAngle={-45,-45,-45,-45,-45,-45,90}](0,0){O}(1,0){I}(2,0){J}(3,0){K}(4,0){L}(5,0){M}(0,2){A}
            \pstSegmentMark[SegmentSymbol=pstslashh]{O}{I}
            \pstSegmentMark[SegmentSymbol=pstslashh]{I}{J}
            \pstSegmentMark[SegmentSymbol=pstslashh]{J}{K}
            \pstSegmentMark[SegmentSymbol=pstslashh]{K}{L}
            \pstSegmentMark[SegmentSymbol=pstslashh]{L}{M}
            \pstLineAB{A}{O}
            \pstLineAB{A}{I}
            \pstLineAB{A}{J}
            \pstLineAB{A}{K}
            \pstLineAB{A}{L}
            \pstLineAB{A}{M}
            }
            \put(2,0){Figure 1}
        \endpspicture
\end{center}
\end{multicols}

\begin{enumerate}[(a)]
    \item Reproduire la figure 1 en prenant $OA=2$~cm et
    $OI=1$~cm.
    \item Quels sont les axes de symétrie de la figure 2 ?
    Compléter la figure 1 afin d'obtenir la figure 2.
    \item Décrire avec précision les axes de symétrie de la figure
    3. Compléter la figure 2 pour obtenir la figure 3.
    \item Colorier la figure 3 à l'aide de deux couleurs en
    alternant les couleurs.
    \item Combien d'axes de symétrie possède la figure 3 ? Et la
    figure coloriée ?
\end{enumerate}

\begin{center}
   \psset{unit=1cm}
        \pspicture(-5,-3)(5,2.5)
          \rput{25}{
            \pstGeonode[PointSymbol=none,PosAngle={-40,-40,-40,-40,-40,-40,90}](0,0){O}(1,0){I}(2,0){J}(3,0){K}(4,0){L}(5,0){M}(0,2){A}            \pstLineAB{A}{O}
            \pstLineAB{A}{I}
            \pstLineAB{A}{J}
            \pstLineAB{A}{K}
            \pstLineAB{A}{L}
            \pstLineAB{A}{M}
            \pstLineAB{O}{M}

            \pstOrtSym[PointSymbol=none,PosAngle=-45]{O}{M}{A}[B]
            \pstLineAB{B}{O}
            \pstLineAB{B}{I}
            \pstLineAB{B}{J}
            \pstLineAB{B}{K}
            \pstLineAB{B}{L}
            \pstLineAB{B}{M}
            \pstLineAB{B}{M}

            \pstOrtSym[PointSymbol=none,PointName=none]{A}{B}{I}[I1]
            \pstOrtSym[PointSymbol=none,PointName=none]{A}{B}{J}[J1]
            \pstOrtSym[PointSymbol=none,PointName=none]{A}{B}{K}[K1]
            \pstOrtSym[PointSymbol=none,PointName=none]{A}{B}{L}[L1]
            \pstOrtSym[PointSymbol=none,PointName=none]{A}{B}{M}[M1]
            \pstLineAB{O}{M1}
            \pstLineAB{A}{I1}
            \pstLineAB{A}{J1}
            \pstLineAB{A}{K1}
            \pstLineAB{A}{L1}
            \pstLineAB{A}{M1}
            \pstLineAB{B}{I1}
            \pstLineAB{B}{J1}
            \pstLineAB{B}{K1}
            \pstLineAB{B}{L1}
            \pstLineAB{B}{M1}
        }
        \put(2,-2){Figure 2}
        \endpspicture
\end{center}
%\begin{comment}
\begin{center}
        \pspicture(-5,-5)(6,2.5)
        \rput{25}{%
            \pstGeonode[PointSymbol=none,PointName=none](0,0){O}(1,0){I}(2,0){J}(3,0){K}(4,0){L}(5,0){M}(0,1.4){A}
            \pstLineAB{A}{O}
            \pstLineAB{A}{I}
            \pstLineAB{A}{J}
            \pstLineAB{A}{K}
            \pstLineAB{A}{L}
            \pstLineAB{A}{M}
            \pstLineAB{O}{M}
            \pstOrtSym[PointSymbol=none,PointName=none]{O}{M}{A}[B]
            \pstLineAB{B}{O}
            \pstLineAB{B}{I}
            \pstLineAB{B}{J}
            \pstLineAB{B}{K}
            \pstLineAB{B}{L}
            \pstLineAB{B}{M}
            \pstLineAB{B}{M}
            \pstOrtSym[PointSymbol=none,PointName=none]{A}{B}{I}[I1]
            \pstOrtSym[PointSymbol=none,PointName=none]{A}{B}{J}[J1]
            \pstOrtSym[PointSymbol=none,PointName=none]{A}{B}{K}[K1]
            \pstOrtSym[PointSymbol=none,PointName=none]{A}{B}{L}[L1]
            \pstOrtSym[PointSymbol=none,PointName=none]{A}{B}{M}[M1]
            \pstLineAB{O}{M1}
            \pstLineAB{A}{I1}
            \pstLineAB{A}{J1}
            \pstLineAB{A}{K1}
            \pstLineAB{A}{L1}
            \pstLineAB{A}{M1}
            \pstLineAB{B}{I1}
            \pstLineAB{B}{J1}
            \pstLineAB{B}{K1}
            \pstLineAB{B}{L1}
            \pstLineAB{B}{M1}
            \pstSymO[PointSymbol=none,PointName=none]{B}{A}[C]
            \pstSymO[PointSymbol=none,PointName=none]{B}{I1}[I2]
            \pstSymO[PointSymbol=none,PointName=none]{B}{J1}[J2]
            \pstSymO[PointSymbol=none,PointName=none]{B}{K1}[K2]
            \pstSymO[PointSymbol=none,PointName=none]{B}{L1}[L2]
            \pstSymO[PointSymbol=none,PointName=none]{B}{M1}[M2]
            \pstLineAB{B}{C}
            \pstLineAB{C}{I2}
            \pstLineAB{C}{J2}
            \pstLineAB{C}{K2}
            \pstLineAB{C}{L2}
            \pstLineAB{C}{M2}
            \pstLineAB{B}{I2}
            \pstLineAB{B}{J2}
            \pstLineAB{B}{K2}
            \pstLineAB{B}{L2}
            \pstLineAB{B}{M2}
            \pstOrtSym[PointSymbol=none,PointName=none]{B}{C}{I2}[I3]
            \pstOrtSym[PointSymbol=none,PointName=none]{B}{C}{J2}[J3]
            \pstOrtSym[PointSymbol=none,PointName=none]{B}{C}{K2}[K3]
            \pstOrtSym[PointSymbol=none,PointName=none]{B}{C}{L2}[L3]
            \pstOrtSym[PointSymbol=none,PointName=none]{B}{C}{M2}[M3]
            \pstLineAB{B}{I3}
            \pstLineAB{B}{J3}
            \pstLineAB{B}{K3}
            \pstLineAB{B}{L3}
            \pstLineAB{B}{M3}
            \pstLineAB{C}{I3}
            \pstLineAB{C}{J3}
            \pstLineAB{C}{K3}
            \pstLineAB{C}{L3}
            \pstLineAB{C}{M3}
            \pstLineAB{M2}{M3}
        }
        \put(3,-4){Figure 3}
        \endpspicture
\end{center}
{\em Attention à la précision des tracés\ldots}
%\end{comment}