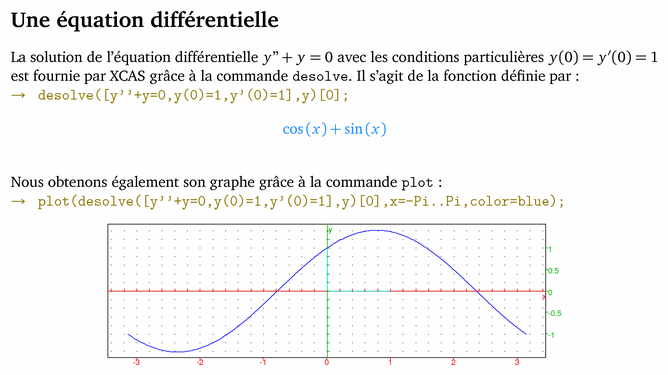
\documentclass[12pt]{article}
\usepackage[latin1]{inputenc}
\usepackage[frenchb]{babel}
\usepackage{amsmath}
\usepackage{xcolor,graphicx}
\usepackage[charter]{mathdesign}
\renewcommand{\ttdefault}{lmtt}
\usepackage[margin=2cm]{geometry}

\pagestyle{empty}
\parindent0pt


\newcommand{\MarqueCommandeGiac}[1]{%
    \color[HTML]{8B7500}$\rightarrow$}
\newcommand{\MarqueLaTeXGiac}{%
    \color[HTML]{1E90FF}}
\newcommand{\InscriptionFigureGiac}[1]{%
    \begin{center}
	\includegraphics[width=0.7\linewidth]{#1}
    \end{center}}


\begin{document}

\section*{Une équation différentielle}
La solution de l'équation différentielle $y"+y=0$ avec les conditions
particulières $y(0)=y'(0)=1$ est fournie par XCAS grâce à la commande
\texttt{desolve}. Il s'agit de la fonction définie par~:

%@Commande-1
{\MarqueCommandeGiac{1} \verb| desolve([y''+y=0,y(0)=1,y'(0)=1],y)[0];|}
{\MarqueLaTeXGiac{}\[ \mbox{cos}\left(x\right)+\mbox{sin}\left(x\right) \]}

Nous obtenons également son graphe grâce à la commande \texttt{plot}~:

%@Commande-2
{\MarqueCommandeGiac{2} \verb| plot(desolve([y''+y=0,y(0)=1,y'(0)=1],y)[0],x=-Pi..Pi,color=blue);|}
\InscriptionFigureGiac{test01-01.pdf}

\end{document}