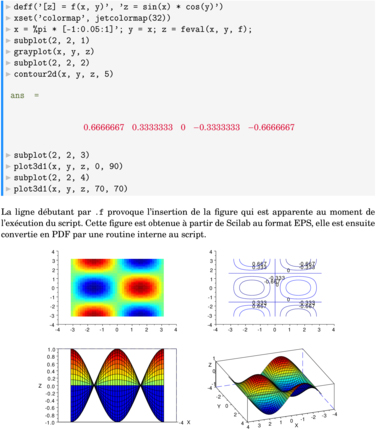
%@PATRON:mary
\parindent0pt
\pagestyle{empty}

\begin{gbar}[DodgerBlue]
{{\color{Silver}\(\blacktriangleright\) }\verb|deff('[z] = f(x, y)', 'z = sin(x) * cos(y)')|}


{{\color{Silver}\(\blacktriangleright\) }\verb|xset('colormap', jetcolormap(32))|}


{{\color{Silver}\(\blacktriangleright\) }\verb|x = %pi * [-1:0.05:1]'; y = x; z = feval(x, y, f);|}


{{\color{Silver}\(\blacktriangleright\) }\verb|subplot(2, 2, 1)|}


{{\color{Silver}\(\blacktriangleright\) }\verb|grayplot(x, y, z)|}


{{\color{Silver}\(\blacktriangleright\) }\verb|subplot(2, 2, 2)|}


{{\color{Silver}\(\blacktriangleright\) }\verb|contour2d(x, y, z, 5)|}

{\color{DarkOliveGreen}
 \begin{verbatim} ans  =
\end{verbatim}
}
{\color{Crimson}\[\begin{matrix}0.6666667&0.3333333&0&-0.3333333&-0.6666667\cr \end{matrix}\]}


{{\color{Silver}\(\blacktriangleright\) }\verb|subplot(2, 2, 3)|}


{{\color{Silver}\(\blacktriangleright\) }\verb|plot3d1(x, y, z, 0, 90)|}


{{\color{Silver}\(\blacktriangleright\) }\verb|subplot(2, 2, 4)|}


{{\color{Silver}\(\blacktriangleright\) }\verb|plot3d1(x, y, z, 70, 70)|}


\end{gbar}

La ligne débutant par \verb|.f| provoque l'insertion de la figure qui
est apparente au moment de l'exécution du script. Cette figure est
obtenue à partir de Scilab au format EPS, elle est ensuite convertie en
PDF par une routine interne au script.


\begin{center}
\includegraphics[width=0.8\linewidth]{image01-001.pdf}
\end{center}