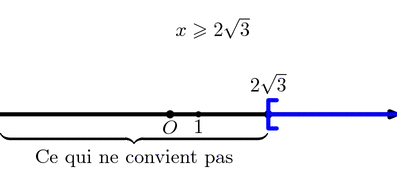
Fichier inequation.mp (figure 10) — Modifié le 21 Mars 2008 à 21 h 46

Source
prologues:=2;

verbatimtex
%&latex
\documentclass{article}
\usepackage{amsmath,amssymb}
\begin{document}
etex

input geometriesyr16;
input TEX;

string pos,sol,style,affichagesolu,affichageval,affichagemath;

style="hachures";
affichagesolu="non";
affichageval="oui";
affichagemath="non";

%Macro pour représenter graphiquement les solutions d'une inéquation
%vardef soline(expr valeur,ang,couleur)=
vardef soline(text val)(expr ang,couleur)=
  for p_ = val:
    if (numeric p_):
       valeur:=p_;
    else:
      picture limite;
      limite=p_;
    fi;
  endfor;
  save $;
  picture dep,$;
  pair ww;
  y.u:=5mm;
  dep=image(
    drawarrow (xpart(z.so*cm),ypart(pp(0,0)))
    --(xpart(z.ne*cm),ypart(pp(0,0))) withpen pencircle scaled 2bp;
    graduantx.bot;
    pair O;
    O=pp(0,0);
    marque_p:="plein";
    pointe(O);
    label.bot(btex $O$ etex,O);
    );
  $=image(
    trace dep;
    ww=pp(valeur,0);
    pointe(ww);
    marque_p:="non";
    if pos="inf":
      if style="hachures":
	draw hachurage(pp(valeur,0.4)--pp(valeur,-0.4)--
	  (xpart(z.ne*cm),ypart(pp(0,-0.4)))--
	  (xpart(z.ne*cm),ypart(pp(0,0.4)))--cycle,ang,0.3,0)
	withcolor couleur
      elseif style="repasse":
	draw (xpart(z.so*cm),ypart(pp(0,0)))--(pp(valeur,0))
	withpen pencircle scaled 2bp withcolor couleur
      fi;
      if sol="non":
	draw pp(valeur+0.3,0.5)--pp(valeur,0.5)
	--pp(valeur,-0.5)--pp(valeur+0.3,-0.5)
	withpen pencircle scaled 2bp withcolor couleur
      elseif sol="oui":
	draw pp(valeur-0.3,0.5)--pp(valeur,0.5)
	--pp(valeur,-0.5)--pp(valeur-0.3,-0.5)
	withpen pencircle scaled 2bp withcolor couleur
      fi;
      if affichagesolu="non":
	long:=abs((xpart(z.ne*cm),ypart(pp(0,-0.4)))-
	  pp(valeur,-0.4));
	label.bot(TEX("$\underbrace{\hbox to"&
	    decimal(long)&"pt{}}_{\hbox{Ce qui ne convient pas}}$"),
	  iso(pp(valeur,-0.4),(xpart(z.ne*cm),
	      ypart(pp(0,-0.4)))));
      elseif affichagesolu="oui":
	long:=abs((xpart(z.so*cm),ypart(pp(0,-0.4)))-
	  pp(valeur,-0.4));
	label.bot(TEX("$\underbrace{\hbox to"&
	    decimal(long)&"pt{}}_{\hbox{Nombres solutions}}$"),
	  iso(pp(valeur,-0.4),(xpart(z.so*cm),
	      ypart(pp(0,-0.4)))));
      fi;
      if affichageval="oui":
	if affichagemath="non":
	  label.top(TEX("$"&decimal(valeur)&"$"),pp(valeur,0.5));
	else:
	  label.top(limite,pp(valeur,0.5));
	fi;
      fi;
    elseif pos="sup":
      if style="hachures":
	draw hachurage(pp(valeur,0.4)--pp(valeur,-0.4)
	  --(xpart(z.so),ypart(pp(0,-0.4)))--
	  (xpart(z.so),ypart(pp(0,0.4)))--cycle,ang,0.3,0)
	withcolor couleur
      elseif style="repasse":
	draw pp(valeur,0)--(x.ne*cm,ypart(pp(0,0)))
	withpen pencircle scaled 2bp withcolor couleur
      fi;
      if sol="non":
	draw pp(valeur-0.3,0.5)--pp(valeur,0.5)
	--pp(valeur,-0.5)--pp(valeur-0.3,-0.5)
	withpen pencircle scaled 2bp withcolor couleur
      elseif sol="oui":
	draw pp(valeur+0.3,0.5)--pp(valeur,0.5)
	--pp(valeur,-0.5)--pp(valeur+0.3,-0.5)
	withpen pencircle scaled 2bp withcolor couleur
      fi;
      if affichagesolu="non":
	long:=abs((xpart(z.so),ypart(pp(0,-0.4)))-
	  pp(valeur,-0.4));
	label.bot(TEX("$\underbrace{\hbox to"&
	    decimal(long)&"pt{}}_{\hbox{Ce qui ne convient pas}}$"),
	  iso(pp(valeur,-0.4),(xpart(z.so),
	      ypart(pp(0,-0.4)))));
      elseif affichagesolu="oui":
	long:=abs((xpart(z.ne*cm),ypart(pp(0,-0.4)))-
	  pp(valeur,-0.4));
	label.bot(TEX("$\underbrace{\hbox to"&
	    decimal(long)&"pt{}}_{\hbox{Nombres solutions}}$"),
	  iso(pp(valeur,-0.4),(xpart(z.ne*cm),
	      ypart(pp(0,-0.4)))));
      fi;
      if affichageval="oui":
	if affichagemath="non":
	  label.top(TEX("$"&decimal(valeur)&"$"),pp(valeur,0.5));
	else:
	  label.top(limite,pp(valeur,0.5));
	fi;
      fi;
    fi;
    );
  $
enddef;

%1
figure(0,-0.5cm,7cm,2.5cm);
trace feuillet withcolor blanc;
label(btex $x\geqslant4$ etex,u*(3.75,2));
x.u:=5mm;
quad.u:=0.5*cm;
origine((6,1));
pos:="sup";
sol:="oui";
draw soline(4)(120,bleu);
fin;
%2
style:="repasse";
figure(0,-0.5u,7cm,2.5cm);
trace feuillet withcolor blanc;
label(btex $x\geqslant4$ etex,u*(3.75,2));
x.u:=5mm;
quad.u:=0.5*cm;
origine((6,1));
pos:="sup";
sol:="oui";
draw soline(4)(120,bleu);
fin;
%3
style:="hachures";
affichagesolu:="oui";
figure(0,-0.5cm,7cm,2.5cm);
trace feuillet withcolor blanc;
label(btex $x\geqslant4$ etex,u*(3.75,2));
x.u:=5mm;
quad.u:=0.5*cm;
origine((2,1));
pos:="sup";
sol:="oui";
draw soline(4)(120,bleu);
fin;
%4
style:="repasse";
affichagesolu:="oui";
figure(0,-0.5u,7cm,2.5cm);
trace feuillet withcolor blanc;
label(btex $x\geqslant4$ etex,u*(3.75,2));
x.u:=5mm;
quad.u:=0.5*cm;
origine((2,1));
pos:="sup";
sol:="oui";
draw soline(4)(120,bleu);
fin;
%5
style:="hachures";
affichagesolu:="non";
figure(0,-0.5cm,7cm,2.5cm);
trace feuillet withcolor blanc;
label(btex $x<4$ etex,u*(3.75,2));
x.u:=5mm;
quad.u:=0.5*cm;
origine((2,1));
pos:="inf";
sol:="non";
draw soline(4)(120,rouge);
fin;
%6
style:="repasse";
affichagesolu:="non";
figure(0,-0.5u,7cm,2.5cm);
trace feuillet withcolor blanc;
label(btex $x<4$ etex,u*(3.75,2));
x.u:=5mm;
quad.u:=0.5*cm;
origine((3,1));
pos:="inf";
sol:="non";
draw soline(4)(120,rouge);
fin;
%7
style:="hachures";
affichagesolu:="oui";
figure(0,-0.5cm,7cm,2.5cm);
trace feuillet withcolor blanc;
label(btex $x<4$ etex,u*(3.75,2));
x.u:=5mm;
quad.u:=0.5*cm;
origine((2,1));
pos:="inf";
sol:="non";
draw soline(4)(120,rouge);
fin;
%8
style:="repasse";
affichagesolu:="oui";
figure(0,-0.5u,7cm,2.5cm);
trace feuillet withcolor blanc;
label(btex $x<4$ etex,u*(3.75,2));
x.u:=5mm;
quad.u:=0.5*cm;
origine((2,1));
pos:="inf";
sol:="non";
draw soline(4)(120,rouge);
fin;
%%%
affichagemath:="oui";
%9
style:="hachures";
affichagesolu:="non";
figure(0,-0.5cm,7cm,2.5cm);
trace feuillet withcolor blanc;
label(btex $x\geqslant2\sqrt3$ etex,u*(3.75,2));
x.u:=5mm;
quad.u:=0.5*cm;
origine((4,1));
pos:="sup";
sol:="oui";
draw soline(3.464,btex $2\sqrt3$ etex)(60,bleu);
fin;
%10
style:="repasse";
figure(0,-0.5u,7cm,2.5cm);
trace feuillet withcolor blanc;
label(btex $x\geqslant2\sqrt3$ etex,u*(3.75,2));
x.u:=5mm;
quad.u:=0.5*cm;
origine((6,1));
pos:="sup";
sol:="oui";
draw soline(3.464,btex $2\sqrt3$ etex)(60,bleu);
fin;
%11
style:="hachures";
affichagesolu:="oui";
figure(0,-0.5cm,7cm,2.5cm);
trace feuillet withcolor blanc;
label(btex $x\geqslant2\sqrt3$ etex,u*(3.75,2));
x.u:=5mm;
quad.u:=0.5*cm;
origine((2,1));
pos:="sup";
sol:="oui";
draw soline(3.464,btex $2\sqrt3$ etex)(60,bleu);
fin;
%12
style:="repasse";
affichagesolu:="oui";
figure(0,-0.5u,7cm,2.5cm);
trace feuillet withcolor blanc;
label(btex $x\geqslant2\sqrt3$ etex,u*(3.75,2));
x.u:=5mm;
quad.u:=0.5*cm;
origine((2,1));
pos:="sup";
sol:="oui";
draw soline(3.464,btex $2\sqrt3$ etex)(60,bleu);
fin;
%13
style:="hachures";
affichagesolu:="non";
figure(0,-0.5cm,7cm,2.5cm);
trace feuillet withcolor blanc;
label(btex $x<-\dfrac43$ etex,u*(3.75,2));
x.u:=5mm;
quad.u:=0.5*cm;
origine((5,1));
pos:="inf";
sol:="non";
draw soline(-1.3333,btex $\displaystyle{-{4\over3}}$ etex)(45,orange);
fin;
%14
style:="repasse";
affichagesolu:="non";
figure(0,-0.5u,7cm,2.5cm);
trace feuillet withcolor blanc;
label(btex $x<-\dfrac43$ etex,u*(3.75,2));
x.u:=5mm;
quad.u:=0.5*cm;
origine((5,1));
pos:="inf";
sol:="non";
draw soline(-1.3333,btex $\displaystyle{-{4\over3}}$ etex)(45,orange);
fin;
%15
style:="hachures";
affichagesolu:="oui";
figure(0,-0.5cm,7cm,2.5cm);
trace feuillet withcolor blanc;
label(btex $x<-\dfrac43$ etex,u*(3.75,2));
x.u:=5mm;
quad.u:=0.5*cm;
origine((8,1));
pos:="inf";
sol:="non";
draw soline(-1.3333,btex $\displaystyle{-{4\over3}}$ etex)(45,orange);
fin;
%16
style:="repasse";
affichagesolu:="oui";
figure(0,-0.5u,7cm,2.5cm);
trace feuillet withcolor blanc;
label(btex $x<-\dfrac43$ etex,u*(3.75,2));
x.u:=5mm;
quad.u:=0.5*cm;
origine((8,1));
pos:="inf";
sol:="non";
draw soline(-1.3333,btex $\displaystyle{-{4\over3}}$ etex)(45,orange);
fin;
end