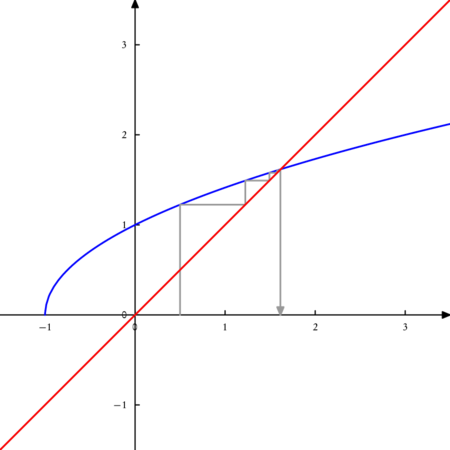
Fichier graphe01.mp (figure 1) — Modifié le 1 Juillet 2011 à 07 h 21

Source
  1  Représentation d'une suite récurrente
  2  %@GIAC:
  3  plotseq(sqrt(1+x),0.5,5);
  4  D:=droite(y=x);
  5  %@STYLE:
  6  global: grille=0 axes=1 cadre=[-1.5,-1.5,3.5,3.5] clip=1 unite=1.5cm courbe_c=blue c=0.6white
  7  D: c=red