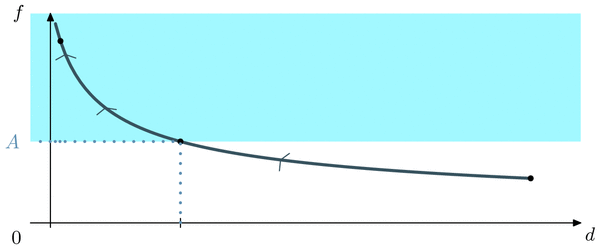
Fichier figure014.mp (figure 1) — Modifié le 8 Avril 2008 à 21 h 26

Source
%@AUTEUR:Guillaume Connan
prologues:=2;

verbatimtex
%&latex
\documentclass{article}
\begin{document}
etex

input courbes;
input geo;

color vert_e, turquoise, orange, vert_fonce, rose, vert_mer, bleu_ciel, or, rouge_v,bleu_m,bleu,bleu_f;
vert_e:=(0,0.790002,0.340007);
turquoise:=(0.250999,0.878399,0.815699);
orange:=(0.589999,0.269997,0.080004);
vert_fonce:=(0,1.4*0.392193,0);
rose:=(1.0, 0.752907, 0.796106);
bleu_ciel:=(1.2*0.529405,1.2*0.807794,1);%.2*0.921598);
or:=(1,0.843104,0);
rouge_v:=(0.829997,0.099994,0.119999);
bleu_m:=(0.7*0.529405,0.7*0.807794,0.7);%*0.921598);
bleu_f:=(0.211762,0.3231176,0.3686392);
bleu:=(0.529405,0.807794,1);

% LIMITE INFINIE EN a NEWTON

% Déclarations des constantes %
numeric xmin, xmax, ymin, ymax, N;

ux:=9cm;  uy:=0.8cm;
xmin := 0 ; xmax := 1.1;
ymin := -.1 ; ymax := 4.7;

% Définitions des axes et labels associés

numeric w; %shift de l'axe vertical
w:=.04*ux;

vardef axes =
  drawarrow (ux*xmin,0) -- (ux*xmax,0) ; % axe des x
  drawarrow ((0,uy*ymin) -- (0,uy*ymax))shifted (w,0); % axe des y
  label.lrt(btex $d$ etex,(xmax*ux,0)); % label de l'axe des x
  label.lft(btex $f$ etex,(0,ymax*uy)); % label de l'axe des y
enddef;


beginfig(1);
  numeric a; % abscisses

  vardef f(expr x) =1/(sqrt x) enddef;

  vardef trace (suffix g)(expr a,b,inc) =
    save i; numeric i;
    for i=a step inc until b:
      (i*ux,f(i)*uy) ..
    endfor (b*ux,f(b)*uy)
  enddef;

  a:=.3;
  path z; %zone rouge

  z:= (0,f(a)*uy)--(xmax*ux,f(a)*uy)--(xmax*ux,ymax*uy)--(0,ymax*uy)--cycle;
  fill z withcolor bleu_ciel;

  axes;

% La courbe

  draw trace(g,.05,1,.01) withcolor bleu_f withpen pencircle scaled 1.5bp;

  label.llft(btex $0$ etex,(-.05*ux,-.1*uy)shifted(w,0));

% Le point M
  draw(ux,uy) withpen pencircle scaled 3bp;

% Flèches
  path p,q,r,s;

  p:=(-.02*ux,-.1*uy)--(0,0)--(.02*ux,-.1*uy);
  q:=p rotated 15;
  r:=p rotated 60;
  s:=p rotated 5;
  draw q shifted (.15*ux,f(.15)*uy) withcolor bleu_f;
  draw r shifted (.5*ux,f(.5)*uy) withcolor bleu_f;
  draw s shifted (.07*ux,f(.07)*uy) withcolor bleu_f;

% Les points N et NA

  numeric b; % abscisses

  b:=.06;

  draw (b*ux,f(b)*uy) withpen pencircle scaled 3bp;

  draw (a*ux,f(a)*uy) withpen pencircle scaled 3bp;

  draw (a*ux,-.1*uy)--(a*ux,.1*uy);

  draw ((-.03*ux,f(a)*uy)--(.03*ux,f(a)*uy))shifted(w,0) withcolor bleu_m dashed withdots withpen pencircle scaled 1.5bp;
  label.lft(btex $A$ etex,(-.05*ux,f(a)*uy)shifted(w,0)) withcolor bleu_m;

  draw (w,f(a)*uy)--(a*ux,f(a)*uy)--(a*ux,0) dashed withdots withcolor bleu_m withpen pencircle scaled 1.5bp;
endfig;
end