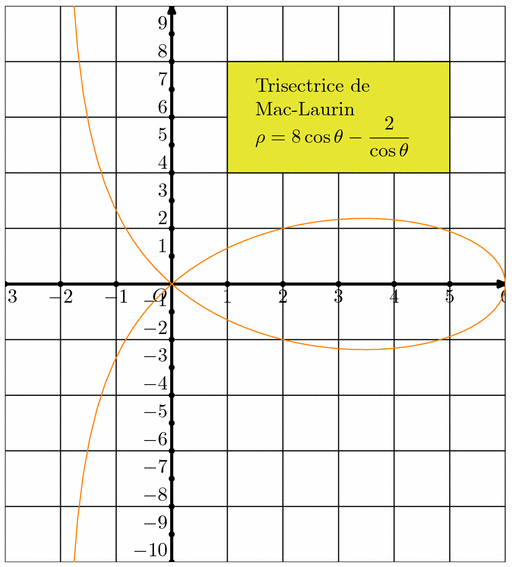
Fichier courbes001.mp (figure 12) — Modifié le 28 Mars 2008 à 21 h 43

Source
%%
verbatimtex
%&latex
\documentclass{article}
\usepackage[latin1]{inputenc}
\usepackage[frenchb]{babel}
\usepackage{amsmath}
\begin{document}
etex
%%
prologues:=2;

input courbescp13;

vardef titre(expr pos,largeur,hauteur,texte)=
  save $;
  picture $;
  $=image(
    fill ((pos shifted(-largeur/2*x.u,-hauteur/2*y.u))--(pos shifted(largeur/2*x.u,-hauteur/2*y.u))--(pos shifted(largeur/2*x.u,hauteur/2*y.u))--(pos shifted(-largeur/2*x.u,hauteur/2*y.u))--cycle) withcolor jaune;
    draw ((pos shifted(-largeur/2*x.u,-hauteur/2*y.u))--(pos shifted(largeur/2*x.u,-hauteur/2*y.u))--(pos shifted(largeur/2*x.u,hauteur/2*y.u))--(pos shifted(-largeur/2*x.u,hauteur/2*y.u))--cycle);

    label(texte,pos);
    );
  $
enddef;

string marque_c;
marque_c="non";
vardef representation[](expr a,b,nb)(text texte)=
  save $;
  path $;
  if marque_c="cartesienne":
    $=courbe@(a,b,nb,texte)
  elseif marque_c="polaire":
    $=polaire@(a,b,nb,texte)
  elseif marque_c="param":
    $=param@(a,b,nb,texte)
  elseif marque_c="polaireparam":
    $=polaireparam@(a,b,nb,texte)
  fi;
  $
enddef;


beginfig(1);%arcsin
  depart((-3,-3.5),(2.5,3.5),(0,0),2,2);
  draw grille(0.5);
  draw axes;
  graduantx.llft;
  graduanty.lft;
  draw courbe1(-1,1,100,arcsin(x)) withcolor bleu;
  draw titre(placepoint(-0.85,1.5),1.25,0.25,btex $y=\arcsin(x)$ etex);
endfig;

beginfig(2);%puissances
  depart((-5,-5),(5,5),(0,0),4,4);
  draw grille(1);
  draw axes;
  graduantx.llft;
  graduanty.lft;
  draw courbe1(-5,5,100,x**2) withcolor bleu;
  draw courbe2(-5,5,100,x**3) withcolor vert;
  draw courbe3(-2,2,100,x**4) withcolor orange;
  draw courbe4(-2,2,100,x**5) withcolor jaune;
endfig;

beginfig(3);%cos
  depart((-6.5,-1.5),(6.5,1.5),(0,0),1,1);
  draw grille(0.1);
  draw axes;
  graduantx.bot;
  graduanty.ulft;
  draw courbe2(-10,10,100,cos(x)) withcolor bleu;
  draw titre(placepoint(-2,1),2,0.5,btex $y=\cos(x)$ etex);
endfig;

beginfig(4);%ln
  depart((-0.5,-3.5),(6.5,2),(0,0),2,1);
  draw grille(0.5);
  draw axes;
  graduantx.bot;
  graduanty.ulft;
  draw courbe2(0.025,10,100,ln(x)) withcolor bleu;
  draw titre(placepoint(0.75,1),1,0.5,btex $y=\ln x$ etex);
endfig;

beginfig(5);%Cardioide
  depart((0,0),(9,10),(1,5),3,3);
  draw grille(1);
  draw axes;
  graduantx.bot;
  graduanty.ulft;
  marque_c:="polaire";
  draw representation2(0,2*pi,100,1+cos(theta)) withcolor orange;
  draw titre(placepoint(2,4/3),2/3,1/3,btex Cardioïde etex);
endfig;

beginfig(6);%Astroide
  depart((-5,-5),(5,5),(0,0),4,4);
  draw grille(1);
  draw axes;
  graduantx.bot;
  graduanty.ulft;
  marque_c:="param";
  draw representation3(0,2*pi,100,((cos(t))**3,(sin(t))**3)) withcolor violet;
  draw titre(placepoint(3/4,1),1/2,1/4,btex Astroïde etex);
endfig;

beginfig(7);
  depart((-5,-5),(5,6),(0,0),2,2);
  draw grille(1);
  draw axes;
  graduantx.bot;
  graduanty.ulft;
  marque_c:="polaireparam";
  draw representation4(0,2*pi,100,((pi/2)*cos(t),sin(t))) withcolor jaune;
  draw titre(placepoint(1,2.5),1.5,3/4,btex $\left\{\begin{array}{l}
    \theta(t)=\dfrac{\pi}{2}\cos t\\
    \rho(t)=\sin t\\
    \end{array}
    \right.$ etex);
endfig;

beginfig(8);
  depart((0,0),(8,6),(1,3),2,2);
  draw grille(1);
  draw axes;
  graduantx.bot;
  graduanty.ulft;
  draw polaire1(-pi,pi,100,3*cos(theta)*cos(2*theta)) withcolor bleu;
  draw titre(placepoint(5/4,1),3/2,1/3,btex $\rho=3\cos\theta\cos(2\theta)$ etex);
endfig;

beginfig(9);
  depart((0,0),(14,16),(10,7),3,3);
  draw axes;
  draw grille(1);
  graduantx.bot;
  graduanty.ulft;
  draw polaire1(0,2*pi,200,(5/3)*cos(2*theta)-cos(theta)) dashed evenly withcolor bleu;
  pair I,A,O;
  O=z.origine*cm;
  A=point(0.5*length Cpo1) of Cpo1;
  I=1/2[z.origine*cm,A];
  dotlabel.llft(btex A etex,A);
  dotlabel.top(btex I etex,I);
  pair m[],M[];
  vues=100;
  for j=0 upto vues:
    m[j]=point(j*length Cpo1/vues) of Cpo1;
    M[j]=((distance(A,I)**2)/(distance(I,m[j])**2))*(m[j]-I);
  endfor;
  path courbeinv;
  courbeinv=M0
  for j=1 upto vues:
    ..M[j]
  endfor;
  draw courbeinv shifted I withcolor rouge;
  draw titre(placepoint(-5/3,2.5),3,1/3,btex Le scarabée (en bleu) et sa courbe inverse (rouge) etex);
endfig;

beginfig(10);
  depart((0,0),(9,10),(1,5),1,1);
  draw axes;
  draw grille(1);
  graduantx.bot;
  graduanty.ulft;
  draw polaire1(-pi/2+0.01,pi/2-0.01,100,(2*(sin(theta))**2)/(cos(theta))) withcolor orange;
  draw titre(placepoint(5,4),3,1,btex Cissoïde droite etex);
  draw titre(placepoint(5,3),2,1,btex $\rho=2\dfrac{\sin^2\theta}{\cos\theta}$ etex);
endfig;

beginfig(11);
  depart((3,0),(12,10),(5,5),1,1);
  draw axes;
  draw grille(1);
  graduantx.bot;
  graduanty.ulft;
  draw polaire1(-pi/2+0.01,pi/2-0.01,100,(2*cos(2*theta))/(cos(theta))) withcolor orange;
  draw titre(placepoint(3.5,4),6,1,btex Strophoïde droite : $\rho=2\dfrac{\cos2\theta}{\cos\theta}$ etex);
endfig;

beginfig(12);
  depart((0,0),(9,10),(3,5),1,0.5);
  draw axes;
  draw grille(1);
  graduantx.bot;
  graduanty.ulft;
  draw polaire1(-pi/2+0.01,pi/2-0.01,100,(8*cos(theta))-2/(cos(theta))) withcolor orange;
  draw titre(placepoint(3,6),4,4,btex\begin{minipage}{3cm} Trisectrice de\\ Mac-Laurin\\$\rho=8\cos\theta-\dfrac{2}{\cos\theta}$\end{minipage} etex);
endfig;

beginfig(13);
  depart((0,0),(9,10),(4,5),1,2);
  draw axes;
  draw grille(1);
  graduantx.bot;
  graduanty.ulft;
  draw courbe1(-5,5,100,4*x/(x**2+1)) withcolor orange;
  draw titre(placepoint(-2,1.5),4,0.5,btex Anguinéa : $y=\dfrac{4x}{x^2+1}$ etex);
endfig;

beginfig(14);
  depart((0,0),(9,10),(1,5),2,1);
  draw axes;
  draw grille(1);
  graduantx.bot;
  graduanty.ulft;
  draw courbe1(0.001,1.9999,100,sqrt((4*(2-x))/x)) withcolor orange;
  draw courbe2(0.001,1.9999,100,-sqrt((4*(2-x))/x)) withcolor orange;
  draw titre(placepoint(2.5,3),3,0.5,btex Cubique d'Agnesi : $xy^2=4(2-x)$ etex);
endfig;

beginfig(15);
  depart((0,0),(9,10),(3,5),1.5,1.5);
  draw axes;
  draw grille(1);
 graduantx.bot;
  graduanty.ulft;
  draw param1(0,2*pi,100,(2*cos(t)+cos(2*t),2*sin(t)-sin(2*t))) withcolor orange;
  draw titre(placepoint(2,2),4,1,btex\begin{minipage}{6cm}Hypocycloïde à trois rebroussements\\$\left\{\begin{tabular}{l}    $x(t)=2\cos t+\cos2t$\\    $y(t)=2\sin t-\sin2t$\\    \end{tabular}    \right.$  \end{minipage}  etex);
endfig;

beginfig(16);
  depart((0,2),(9,10),(1,5),2,2);
  draw axes;
  draw grille(1);
  graduantx.bot;
  graduanty.ulft;
  draw param1(0,2*pi,100,(2*(cos(t))**2,4*((cos(t))**3)*sin(t))) withcolor orange;
  draw titre(placepoint(1.5,2),2,1,btex\begin{minipage}{4cm}
    Quartique piriforme\\$\left\{\begin{tabular}{l}    $x(t)=2\cos^2t$\\    $y(t)=4\cos^3t\sin t$\\    \end{tabular}    \right.$ \end{minipage}   etex);
endfig;

beginfig(17);
  depart((0,0),(9,10),(5,5),1,1);
  draw axes;
  draw grille(1);
graduantx.bot;
  graduanty.ulft;
  draw polaire1(0.001,pi/4-0.001,100,sqrt(4/tan(2*theta))) withcolor orange;
  draw polaire1(0.001,pi/4-0.001,100,-sqrt(4/tan(2*theta))) withcolor orange;
  draw polaire1(-pi/2+0.001,-pi/4-0.001,100,sqrt(4/tan(2*theta))) withcolor orange;
  draw polaire1(-pi/2+0.001,-pi/4-0.001,100,-sqrt(4/tan(2*theta))) withcolor orange;

  draw titre(placepoint(-3,-3),4,1.5,btex\begin{minipage}{4cm} Quartique régulière\\$\rho^2=\dfrac{4}{\tan2\theta}$\end{minipage} etex);
endfig;

beginfig(18);
  depart((0,0),(9,10),(2,5),0.25,2);
  draw axes;
  draw grille(1);
  graduationx(btex $+1$ etex,4);
  graduanty.ulft;
  draw courbe1(-8,28,200,exp(-x/4)*sin(x)) withcolor orange;
  draw titre(placepoint(12,1),22,0.5,btex Sinusoïde amortie : $y=e^{-\dfrac{x}{4}}\sin x$ etex);
endfig;

beginfig(19);
  depart((0,2),(9,10),(5,5),1,1);
  draw axes;
  draw grille(1);
  graduantx.bot;
  graduanty.ulft;
  draw polaire1(-23,21,500,3/(ch(theta/5))) withcolor orange;
  draw titre(placepoint(-3,4),3,1.5,btex\begin{minipage}{3cm} Spirale de Poinsot\\$\rho=\dfrac{3}{\mbox{ch}(\theta/5)}$\end{minipage} etex);
endfig;
end