%@Auteur: François Meria\par
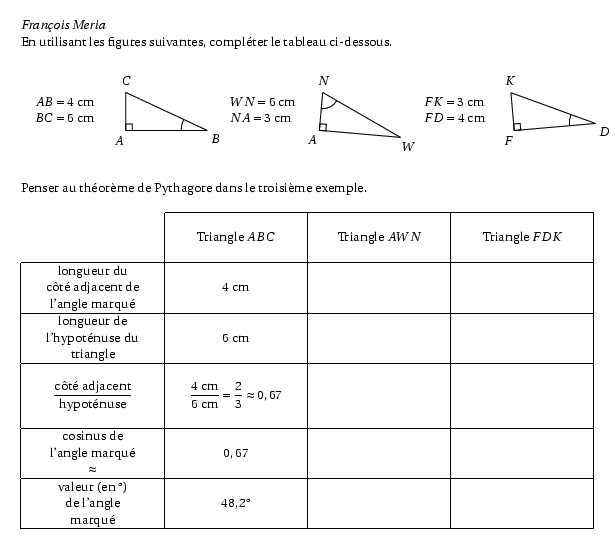
En utilisant les figures suivantes, compléter le tableau
ci-dessous.

 \vskip 1.5cm

\begin{multicols}{3}
\begin{tabular}{ll}
\pspicture(0,-1)(2.5,1)
    \put(0,0.5){\begin{tabular}{l}$AB=4$~cm \\ $BC=6$~cm \end{tabular}}
\endpspicture
 &
 \psset{unit=1cm}
    \pspicture(0,-1)(2.5,1)
        \pstGeonode[PointSymbol=none,PosAngle={235,-45}](0,0){A}(2.5,0){B}
        \pstGeonode[PointSymbol=none,PointName=none](0,0.5){T}
        \pstRotation[RotAngle=-25,PointName=none,PointSymbol=none]{B}{A}{S}
        \pstInterLL[PointSymbol=none,PosAngle=90]{A}{T}{B}{S}{C}
        \pstRightAngle[RightAngleSize=0.2]{B}{A}{C}
        \pstLineAB{A}{B} \pstLineAB{A}{C} \pstLineAB{B}{C}
        \pstMarkAngle[MarkAngleRadius=0.8]{C}{B}{A}{}
    \endpspicture
\\
\end{tabular}

\begin{tabular}{ll}
\pspicture(0,-1)(2.5,1)
    \put(0,0.5){\begin{tabular}{l}$WN=6$~cm \\ $NA=3$~cm \end{tabular}}
\endpspicture
 &
 \psset{unit=1cm}
    \pspicture(0,-1)(2.5,1)
     \rput{-5}{
        \pstGeonode[PointSymbol=none,PosAngle={235,-45}](0,0){A}(2.5,0){W}
        \pstGeonode[PointSymbol=none,PointName=none](0,0.5){T}
        \pstRotation[RotAngle=-25,PointName=none,PointSymbol=none]{W}{A}{S}
        \pstInterLL[PointSymbol=none,PosAngle=90]{A}{T}{W}{S}{N}
        \pstRightAngle[RightAngleSize=0.2]{W}{A}{N}
        \pstLineAB{A}{W} \pstLineAB{A}{N} \pstLineAB{W}{N}
        \pstMarkAngle[MarkAngleRadius=0.5]{A}{N}{W}{}
        }
    \endpspicture
\\
\end{tabular}

\begin{tabular}{ll}
\pspicture(0,-1)(2.5,1)
    \put(0,0.5){\begin{tabular}{l}$FK=3$~cm \\ $FD=4$~cm \end{tabular}}
\endpspicture
 &
 \psset{unit=1cm}
    \pspicture(0,-1)(2.5,1)
    \rput{5}{
        \pstGeonode[PointSymbol=none,PosAngle={235,-45}](0,0){F}(2.5,0){D}
        \pstGeonode[PointSymbol=none,PointName=none](0,0.5){T}
        \pstRotation[RotAngle=-25,PointName=none,PointSymbol=none]{D}{F}{S}
        \pstInterLL[PointSymbol=none,PosAngle=90]{F}{T}{D}{S}{K}
        \pstRightAngle[RightAngleSize=0.2]{D}{F}{K}
        \pstLineAB{F}{D} \pstLineAB{F}{K} \pstLineAB{D}{K}
        \pstMarkAngle[MarkAngleRadius=0.8]{K}{D}{F}{}
        }
    \endpspicture
\\
\end{tabular}
\end{multicols}

Penser au théorème de Pythagore dans le troisième exemple.

\vskip 0.5cm

\begin{center}
\begin{tabularx}{\textwidth}{|>{\centering}X|>{\centering}X|>{\centering}X|>{\centering}X|}
\cline{2-4} \multicolumn{1}{c|}{}               & & & \\
\multicolumn{1}{c|}{}               & Triangle $ABC$ & Triangle
$AWN$& Triangle $FDK$ \tabularnewline
\multicolumn{1}{c|}{}               & & & \tabularnewline \hline
longueur du & & & \tabularnewline côté adjacent de &   4~cm
&                & \tabularnewline l'angle marqué & & &
\tabularnewline \hline longueur de & & & \tabularnewline
l'hypoténuse du                  &     6~cm           &
&                          \tabularnewline triangle & & &
\tabularnewline \hline
 & & & \tabularnewline
 $\dfrac{\textrm{côté adjacent}}{\textrm{hypoténuse}}$                &       $\dfrac{4~\textrm{cm}}{6~\textrm{cm}}=\dfrac{2}{3}\approx 0,67$         &                &                          \tabularnewline
 & & & \tabularnewline
\hline cosinus de & & & \tabularnewline
  l'angle marqué               &       $0,67$         &                &                          \tabularnewline
$\approx$ & & & \tabularnewline \hline valeur (en °) & & &
\tabularnewline de l'angle                 &        $48,2$°
&                &                          \tabularnewline marqué
& & & \tabularnewline \hline
\end{tabularx}
\end{center}