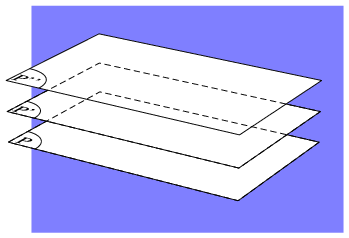
\documentclass{article}
\usepackage{pst-solides3d}
\begin{document}
\pagestyle{empty}


\begin{pspicture}(-4,-3)(7,5)%
\psframe*[linecolor=blue!50](-4,-3)(7,5)
\psset{viewpoint=40 25 20,Decran=60}
\psset{solidmemory}
%% definition du plan P
\psSolid[object=plan,
   definition=equation,
   args={[0 0 1 0] 90},
   base=-4 4 -2 3,
   fillcolor=white,
   name=P,
]
\psset{plan=P}
%% legende du plan
\psProjection[object=texte,
   fontsize=20,
   text=P,
   pos=cc,
](-3.65,-1.65)
\psProjection[object=cercle,
   args=-4 -2 1,
   range=0 90,
]
%%
%% definition du plan P1
\psSolid[object=plan,
   definition=equation,
   args={[0 0 1 -1] 90},
   base=-4 4 -2 3,
   fillcolor=white,
   name=P1,
]
\psset{plan=P1}
%% legende du plan
\psProjection[object=texte,
   fontsize=20,
   text=P',
   pos=cc,
](-3.65,-1.65)
\psProjection[object=cercle,
   args=-4 -2 1,
   range=0 90,
]
%% definition du plan P2
\psSolid[object=plan,
   definition=equation,
   args={[0 0 1 -2] 90},
   base=-4 4 -2 3,
   fillcolor=white,
   name=P2,
]
\psset{plan=P2}
%% legende du plan
\psProjection[object=texte,
   fontsize=20,
   text=P'',
   pos=cc,
](-3.55,-1.6)
\psProjection[object=cercle,
   args=-4 -2 1.2,
   range=0 90,
]
%% dessin du plan P1 en pointilles
\psSolid[object=plan,
   args=P1,
   linestyle=dashed,
   action=draw,
%   fillcolor=yellow,
]
%% dessin du plan P en pointilles
\psSolid[object=plan,
   args=P,
   linestyle=dashed,
   action=draw,
%   fillcolor=yellow,
]
\psset{fontsize=15}
\composeSolid
%\axesIIID(4,4,2)(5,5,6)
\end{pspicture}


\end{document}