\documentclass[12pt]{article}
\usepackage{pst-anamorphosis-add,pst-plot,pst-grad}
\usepackage[a4paper]{geometry}

\makeatletter
\def\psparametricplotA{\pst@object{parametricplotA}}% 	hv 2008-11-22
\def\parametricplotA{\pst@object{parametricplotA}}
\def\parametricplotA@i#1#2{\@ifnextchar[{\parametricplotA@x{#1}{#2}}{\parametricplotA@x{#1}{#2}[]}}
\def\parametricplotA@x#1#2[#3]{\@ifnextchar[{\parametricplotA@xi{#1}{#2}[#3]}{\parametricplotA@xi{#1}{#2}[#3][]}}
\def\parametricplotA@xi#1#2[#3][#4]#5{%
  \pst@killglue%
  \begingroup%
    \use@par%
    \@nameuse{beginplot@\psplotstyle}%
    \addto@pscode{%
    \tx@optionsanamorphosis
    \tx@optionsanamorphosisAdd
      #3 %prefix PS code
      \psplot@init
      /t #1 def
      /t1 #2 def
      /dt t1 t sub \psk@plotpoints div def
      /F@pstplot \ifPst@algebraic (#5)
                    \ifx\psk@PlotDerivative\@none\else
                      \psk@PlotDerivative\space { (t) tx@Derive begin Derive end } repeat
                    \fi\space
                    tx@AlgToPs begin AlgToPs end cvx
                 \else { #5 } \fi  def
      \ifPst@VarStep
         /StillZero 0 def /LastNonZeroStep dt def
         /F2@pstplot tx@Derive begin (#5) (t) Derive (t) Derive end
                     \ifx\psk@PlotDerivative\@none\else
                       \psk@PlotDerivative\space { (t) tx@Derive begin Derive end } repeat
                     \fi\space
                    tx@AlgToPs begin AlgToPs end cvx def
         %% computation of the tolerance defined by plotpoints
         /epsilon12 \ifx\psk@VarStepEpsilon\@default
                       tx@Derive begin F2@pstplot end Pyth
                       dt 3 exp abs mul
                    \else\psk@VarStepEpsilon\space 12 mul \fi def
         /ComputeStep {
           dup 1e-4 lt
           { pop StillZero 2 ge { LastNonZeroStep 2 mul } { LastNonZeroStep } ifelse /StillZero StillZero 1 add def }
           { epsilon12 exch div 1 3 div exp /StillZero 0 def }
           ifelse } bind def
      \fi
      /xy {
        \ifPst@algebraic F@pstplot \else #5 \fi
        \pst@number\psyunit mul exch
        \pst@number\psxunit mul exch
        tx@anamorphosisPathDict begin Anamorphose end
      } def
      }%
    \gdef\psplot@init{}%
    \@pstfalse
    \@nameuse{testqp@\psplotstyle}%
    \if@pst\parametricplotA@ii{#4}\else\parametricplotA@iii{#4}\fi
  \endgroup%
  \ignorespaces}
%
\def\parametricplotA@ii#1{% para is the post code
  \ifPst@VarStep%
    \addto@pscode{%
      mark xy \@nameuse{beginqp@\psplotstyle}
      { F2@pstplot Pyth ComputeStep
        t 2 copy add dup t1 gt {pop t1} if /t exch def F2@pstplot Pyth ComputeStep
        /t 3 -1 roll def 2 copy gt { exch } if pop
        /t t 3 -1 roll add dup t1 gt {pop t1} if def
        xy \@nameuse{doqp@\psplotstyle}
        t t1 eq { exit } if } loop}%
  \else\pst@killglue%
    \addto@pscode{%
      /ps@Exit false def
      xy \@nameuse{beginqp@\psplotstyle}
      \psk@plotpoints 1 sub {
        /t t dt add def
        xy \@nameuse{doqp@\psplotstyle}
        ps@Exit { exit } if
      } repeat
      ps@Exit not {
        /t t1 def
        xy \@nameuse{doqp@\psplotstyle}
      } if
    }%
  \fi%
  \addto@pscode{ #1 }%
  \@nameuse{endqp@\psplotstyle}}
%
\def\parametricplotA@iii#1{%
  \ifPst@VarStep%
    \addto@pscode{%
      /n 2 def
      mark
      { xy n 2 roll F2@pstplot Pyth
        ComputeStep t 2 copy add dup t1 gt {pop t1} if
        /t exch def F2@pstplot Pyth ComputeStep
        /t 3 -1 roll def 2 copy gt { exch } if pop
        /t t 3 -1 roll dup /LastNonZeroStep exch def add dup t1 gt {pop t1} if def /n n 2 add def
        t t1 eq { exit } if } loop
      xy n 2 roll}%
  \else\pst@killglue%
    \addto@pscode{
      mark
      /n 2 def
      \psk@plotpoints {
        xy
        n 2 roll
        /n n 2 add def
        /t t dt add def
      } repeat
      /t t1 def
      xy
      n 2 roll}%
  \fi%
  \addto@pscode{ #1 }%
  \@nameuse{endplot@\psplotstyle}}
%
\makeatother
\pagestyle{empty}
\begin{document}
\begin{center}
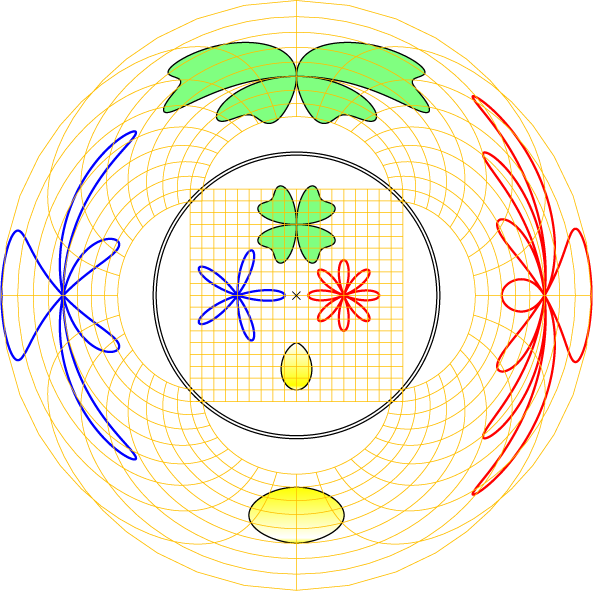
\begin{pspicture}(-6,-6)(6,6)
\pscircle[doubleline=true]{3}
\psset{type=conical}
\parametricplot[plotpoints=3600,linecolor=red,linewidth=0.5mm]{0}{360}{%
  /Radius 0.75 t 4 mul cos mul def
   Radius t cos mul 1 add
  Radius t sin mul
    }
\parametricplotA[plotpoints=3600,linecolor=red,linewidth=0.5mm]{0}{360}{%
  /Radius 0.75 t 4 mul cos mul def
   Radius t cos mul 1 add
  Radius t sin mul
    }
\parametricplot[plotpoints=3600,linecolor=blue,linewidth=0.5mm]{0}{360}{%
  /Radius 1 t 5 mul cos mul def
   Radius t cos mul -1.25 add
  Radius t sin mul
    }
\parametricplotA[plotpoints=3600,linecolor=blue,linewidth=0.5mm]{0}{360}{%
  /Radius 1 t 5 mul cos mul def
   Radius t cos mul -1.25 add
  Radius t sin mul
    }
\parametricplot[plotpoints=3600,fillstyle=solid,fillcolor=green!50]{0}{360}{%
  /Radius 1 t 2 mul sin t 6 mul sin 4 div add mul def
   Radius t cos mul
  Radius t sin mul 1.5 add
    }
\parametricplotA[plotpoints=3600,fillstyle=solid,fillcolor=green!50]{0}{360}{%
   /Radius 1 t 2 mul sin t 6 mul sin 4 div add mul def
   Radius t cos mul
  Radius t sin mul 1.5 add
    }
\parametricplot[plotpoints=3600,fillstyle=gradient,gradend=yellow,gradbegin=white]{0}{360}{%
  /Radius 1 t cos 3 exp mul def
    Radius t sin mul 0 add
   Radius t cos mul 1 add neg
    }
\parametricplotA[plotpoints=3600,fillstyle=gradient,gradbegin=yellow,gradend=white]{0}{360}{%
  /Radius 1 t cos 3 exp mul def
    Radius t sin mul 0 add
   Radius t cos mul 1 add neg
    }
{\psset{linewidth=0.5\pslinewidth,linecolor={[rgb]{1 0.75 0}}}
\multido{\n=0.25+0.25,\N=0.25+0.25}{9}{%
    \pnode(! \n\space -2.25){A}
    \pnode(! \n\space 2.25){B}
    \psline(A)(B)
    \pslineA(A)(B)
    \pnode(!-2.25 \N){A}
    \pnode(!2.25 \N){B}
    \pslineA(A)(B)
    \psline(A)(B)
    }
\multido{\n=-2.25+0.25,\N=-2.25+0.25}{9}{%
    \pnode(! \n\space -2.25){A}
    \pnode(! \n\space 2.25){B}
    \psline(A)(B)
    \pslineA(A)(B)
    \pnode(!-2.25 \N){A}
    \pnode(!2.25 \N){B}
    \pslineA(A)(B)
    \psline(A)(B)
    }
\psline(-2.25,0)(2.25,0)
\psline(0,-2.25)(0,2.25)
\pslineA(0,-2.25)(0,-0.25)
\pslineA(0,2.25)(0,0.25)
\pslineA(-2.25,0)(-0.25,0)
\pslineA(2.25,0)(0.25,0)}
\psdot[dotstyle=x,dotsize=.2](0,0)
\end{pspicture}
\end{center}
\end{document}