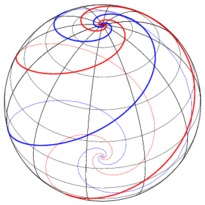
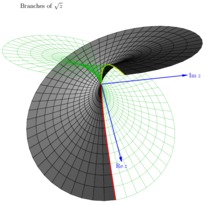
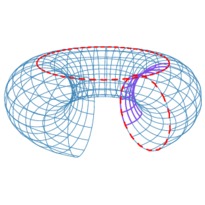
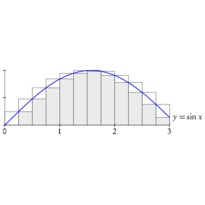
En cliquant sur une imagette, vous accéderez au source et à l'image. En cliquant sur cette dernière, vous ouvrirez le fichier PDF associé.
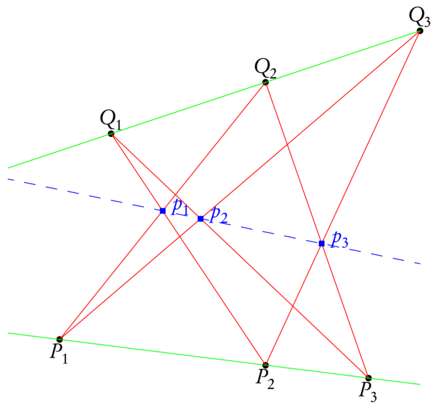
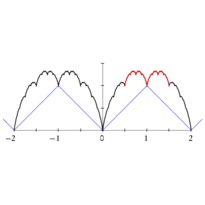
/* -*-ePiX-*- */
#include "epix.h"
using namespace ePiX;

int main()
{
  bounding_box(P(-2,-2),P(2,2));
  unitlength("1in");
  picture(3,3);
  offset(1.25, 0);

  begin();
  crop();


  P V = P(2,-0.25),   W = P(3,1);
  P P1=P(-1.5,-1),    P2 = P1 + V,       P3 = P1 + 1.5*V;    // points
  P Q1 = P(-1,1),     Q2 = Q1 + 0.5*W,   Q3 = Q1 + W;

  segment L12(P1, Q2),   L13(P1, Q3);
  segment L21(P2, Q1),   L23(P2, Q3);
  segment L31(P3, Q1),   L32(P3, Q2);

  P R1 = L12*L21,    R2 = L13*L31,    R3 = L32*L23;   // points of intersection

  dot(P1, P(0,-2), "$P_1$", b);   dot(Q1, P(0,2), "$Q_1$", t);
  dot(P2, P(0,-2), "$P_2$", b);   dot(Q2, P(0,2), "$Q_2$", t);
  dot(P3, P(0,-2), "$P_3$", b);   dot(Q3, P(0,2), "$Q_3$", t);

  red();  L12.draw();  L21.draw();  L13.draw();  L31.draw();  L32.draw();  L23.draw();

  green();    Line(P1,P3);    Line(Q1,Q3);

  blue();
  box(R1, P(4,2), "$p_1$", r);
  box(R2, P(4,2), "$p_2$", r);
  box(R3, P(4,2), "$p_3$", r);

  dashed();    Line(R1,R3);
  end();
}