En cliquant sur une imagette, vous accéderez au source et à l'image. En cliquant sur cette dernière, vous ouvrirez le fichier PDF associé.
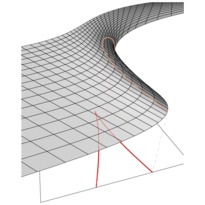
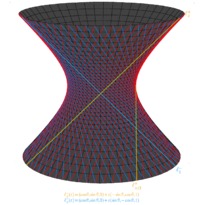
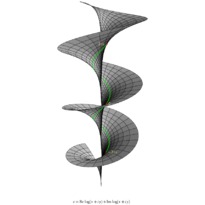
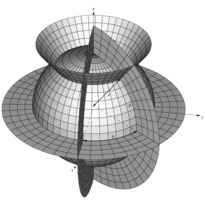
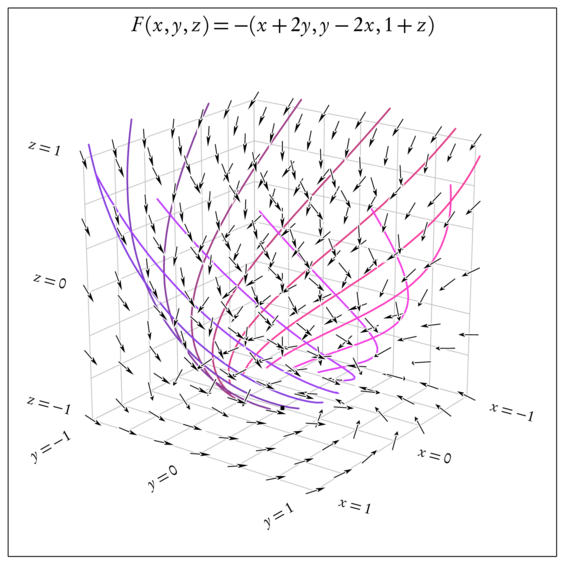
/* -*-ePiX-*- */
#include "epix.h"
using namespace ePiX;

// A spatial vector field depending on three variables
P F(double x, double y, double z)
{
  return -0.25*P(0.5*x+y, 0.5*y-x, 1+z);
}

domain R(P(-1,-1,-1), P(1,1,1), mesh(6,6,4), mesh());

int main()
{
  bounding_box(P(-2,-2),P(2,2));
  unitlength("1in");
  picture(4,4);

  use_pstricks(); // used for layering of elements

  begin();
  grid();
  label(P(0, y_max), P(0,-4), "$F(x,y,z)=-(x+2y, y-2x, 1+z)$",b);
  use_pstricks(false); // turn off to draw flow lines in color

  camera.at(P(11,8,5));

  // coordinate grids
  const double GRAY(0.75);
  const int GRIDS(6);
  rgb(GRAY, GRAY, GRAY);
  grid(P(-1, -1,-1), P(-1, 1, 1), GRIDS, GRIDS);
  grid(P(-1, -1,-1), P( 1,-1, 1), GRIDS, GRIDS);
  grid(P(-1, -1,-1), P(1, 1, -1), GRIDS, GRIDS);

  // flow lines
  bold();
  for (int i=0; i<12; ++i)
    {
      double t(M_PI_2+i*M_PI/6);
      rgb(0.25*(3+Sin(t)), 0.25, 0.25*(3+Cos(t)));
      ode_plot(F, cyl(1.4, t, 1), 0, 10, 60);
    }

  plain();
  black();

  use_pstricks();
  // draw arrows in plain black borderd by a white edge;
  // vectors will appear to hide vectors behind them
  psset("fillcolor=black,bordercolor=white,border=0.5pt");
  // arrow_fill(1);
  arrow_camber(0.25);

  // the field is drawn in successive slices x_3 = const
#ifdef VECT
  vector_field(F, R, 0.75); // draw arrowheads at 75% of default size
#else
  dart_field(F, R, 0.5);  // draw darts at 50% of default length
#endif

  const double DX(0.125); // label padding
  font_size("scriptsize");
  degrees();

  label_angle(30); // adjusted visually; could calculate from camera position
  label(P(1+DX, -1, -1), P(-4,-2), "$y=-1$", bl);
  label(P(1+DX,  0, -1), P(-4,-2), "$y=0$", bl);
  label(P(1+DX,  1, -1), P(-4,-2), "$y=1$", bl);

  label_angle(-15);
  label(P(-1, 1+DX, -1), P(4,0), "$x=-1$", br);
  label(P( 0, 1+DX, -1), P(4,0), "$x=0$", br);
  label(P( 1, 1+DX, -1), P(4,0), "$x=1$", br);

  label(P( 1, -1-DX, -1), P(-4,0), "$z=-1$", tl);
  label(P( 1, -1-DX,  0), P(-4,0), "$z=0$", tl);
  label(P( 1, -1-DX,  1), P(-4,0), "$z=1$", tl);

  end();
}