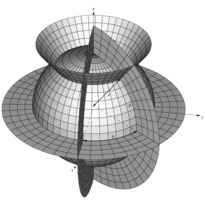
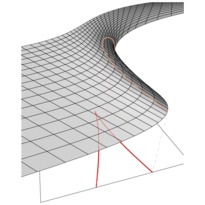
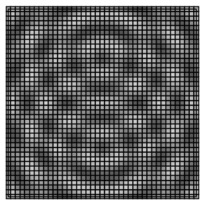
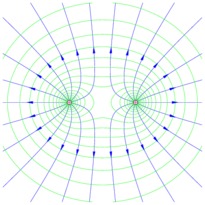
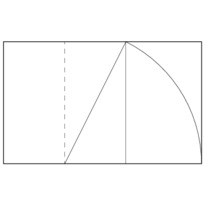
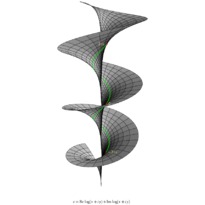
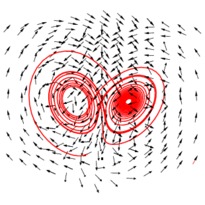
En cliquant sur une imagette, vous accéderez au source et à l'image. En cliquant sur cette dernière, vous ouvrirez le fichier PDF associé.
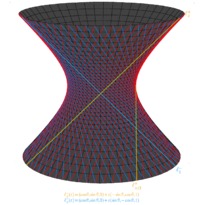
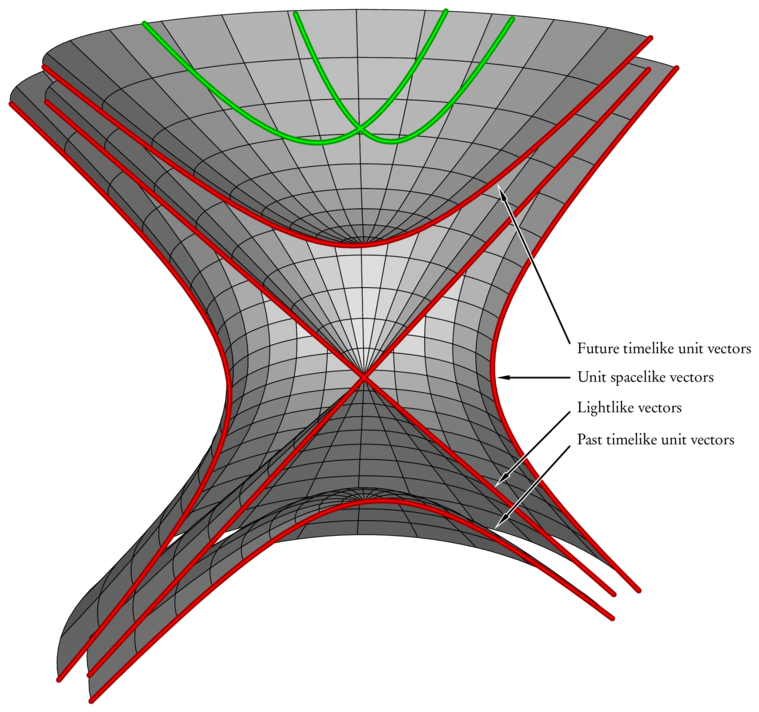
/* -*-ePiX-*- */
#include "epix.h"
using namespace ePiX;

const double MAX(3);

// hyperboloid of one sheet/spacelike cone
P Fp(double x, double y, double z)
{
  return P(z*cosh(x)*Cos(y), z*cosh(x)*Sin(y), z*sinh(x));
}

// hyperboloid of two sheets/timelike cone
P Fm(double x, double y, double z)
{
  return P(z*sinh(x)*Cos(y), z*sinh(x)*Sin(y), z*cosh(x));
}

// light cone
P Fz(double x, double y)
{
  return fabs(sinh(x))*P(Cos(y), Sin(y), sgn(x));
}

// hyperbolic lines
P hl1(double t)
{
  return cosh(t)*P(-sqrt(1.25),0,1.5) + sinh(t)*E_2;
}

P hl2(double t)
{
  return cosh(t)*P(-1,0.5,1.5) + (sqrt(0.4)*sinh(t))*P(0.5, 1, 0);
}

int main()
{
  bounding_box(P(-MAX,-MAX),P(MAX,MAX));
  unitlength("1in");
  picture(6,6);

  begin();
  camera.at(10,-3,4);
  //  camera.range(40);

  revolutions();

  domain R(P(-1.5,0.25,-1), P(1.5,0.75,1), mesh(18, 12, 4), mesh(36, 48, 12));

  // assemble surfaces as a single object
  scenery hyp(Fp, R.slice3(1));
  hyp.add(Fm, R.resize1(0,1.5).slice3(1));
  hyp.add(Fm, R.resize1(-1.5,0).slice3(-1));
  hyp.add(Fz, R.slice3(1));

  fill();
  hyp.draw();
  fill(false);

  // Draw cuts of intersection with (y,z)-plane.
  // Simulated 3-D/tube pen: light color drawn over darker shade
  pen(3);
  red(0.6);
  plot(Fp, R.slice2(0.25).slice3(1));
  plot(Fp, R.slice2(0.25).slice3(-1));

  plot(Fm, R.slice2(0.25).slice3(1));
  plot(Fm, R.slice2(0.25).slice3(-1));

  plot(Fz, R.slice2(0.25).slice3(1));
  plot(Fz, R.slice2(0.75).slice3(-1));

  // to clip lines
  clip();
  clip_box(P(-10,-10,-cosh(1.5)), P(10,10,cosh(1.5)));

  green(0.6);
  plot(hl1, -1.5, 1.5, 120);
  plot(hl2, -1.5, 1.5, 120);

  bold();
  red();
  plot(Fp, R.slice2(0.25).slice3(1));
  plot(Fp, R.slice2(0.25).slice3(-1));

  plot(Fm, R.slice2(0.25).slice3(1));
  plot(Fm, R.slice2(0.25).slice3(-1));

  plot(Fz, R.slice2(0.25).slice3(1));
  plot(Fz, R.slice2(0.75).slice3(-1));

  green();
  plot(hl1, -1.5, 1.5, 120);
  plot(hl2, -1.5, 1.5, 120);

  // Labels with "overlay" arrows
  font_size("scriptsize");
  black();
  camera.at(P(0,0,EPIX_INFTY));
  label(P(1.5,0), P(4,16), "Future timelike unit vectors", r);
  label(P(1.5,0), P(4,0), "Unit spacelike vectors", r);
  label(P(1.5,0), P(4,-16), "Lightlike vectors", r);
  label(P(1.5,0), P(4,-32), "Past timelike unit vectors", r);

  pen(2);
  white();
  arrow(P(1.5, 0.25), P(1,1.35), 0.5);
  arrow(P(1.5,-0.25), P(1,-0.75), 0.5);
  arrow(P(1.5,-0.5), P(1,-1.05), 0.5);

  arrow_fill(1);
  bold();
  black();
  arrow(P(1.5,0), P(1,0), 0.5);
  arrow(P(1.5, 0.25), P(1,1.35), 0.5);
  arrow(P(1.5,-0.25), P(1,-0.75), 0.5);
  arrow(P(1.5,-0.5), P(1,-1.05), 0.5);

  end();
}