En cliquant sur une imagette, vous accéderez au source et à l'image. En cliquant sur cette dernière, vous ouvrirez le fichier PDF associé.
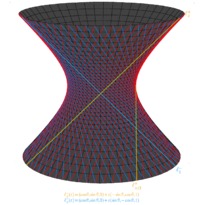
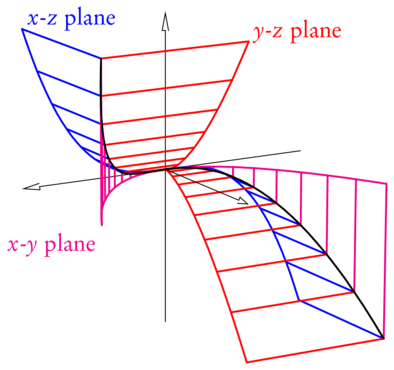
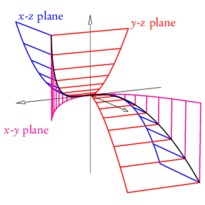
/* -*-ePiX-*- */
/* stereo-left.c -- November 25, 2001 */
#include "epix.h"
using namespace ePiX;

double   u1(double t) {return t;}
double   u2(double t) {return t*t;}
double   u3(double t) {return t*t*t;}
double zero(double t) {return 0;}

int N=60;

main()
{
  unitlength("1pt");
  bounding_box(P(-1,-1), P(1,1));
  picture(P(150,150));

  begin();

  viewpoint(1, 1.75, 0.5);
  camera.range(20);

  // coordinate axes
  arrow(P(-1,0,0), P(1,0,0));
  arrow(P(0,0,-1), P(0,0,1));

  bold();
  blue();
  plot(u1, zero, u3, -1, 1, N);
  double t=-1;
  for (int i=0; i<=20; ++i, t += 0.1)
    line(P(u1(t), 0, u3(t)), P(u1(t), u2(t), u3(t)));

  label(P(1,0,1), P(2,2), "$x$-$z$ plane");

  red();
  plot(zero, u2, u3, -1, 1, N);
  t = -1;
  for (int i=0; i<=20; ++i, t += 0.1)
    line(P(0, u2(t), u3(t)), P(u1(t), u2(t), u3(t)));

  label(P(0,1,1), P(2,2), "$y$-$z$ plane");

  magenta();
  plot(u1, u2, zero, -1, 1, N);
  t = -1;
  for (int i=0; i<=20; ++i, t += 0.1)
    line(P(u1(t), u2(t), 0), P(u1(t), u2(t), u3(t)));

  label(P(1,1,0), P(-45,-12), "$x$-$y$ plane");
  black();

  /* The cubic */
  plot(u1, u2, u3, -1, 1, N);

  plain();
  arrow(P(0,0,0), P(0,1,0));

  end();
}