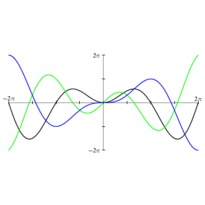
En cliquant sur une imagette, vous accéderez au source et à l'image. En cliquant sur cette dernière, vous ouvrirez le fichier PDF associé.
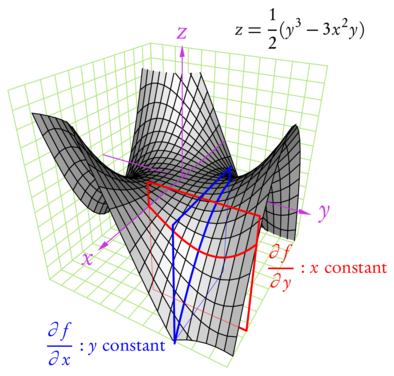
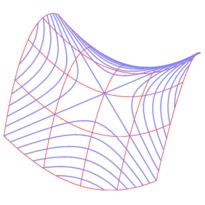
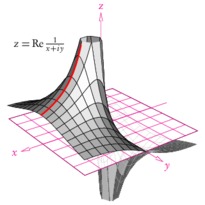
/* -*-ePiX-*- */
/*
 * ePiX surface demo image, June 08, 2006
 *
 * This file illustrates the use of pstricks (for color-filled
 * arrowheads), manual layering of figure elements (for hidden-surface
 * removal), and simulated transparency.
 */
#include "epix.h"
using namespace ePiX;

// Style parameters
// camera location (in spherical coordinates); must be in first orthant
const P VIEWPT=sph(4, M_PI/6, M_PI/6);

// colors
void color_coord(void)  { rgb(0.7, 0.9, 0.5); }
void color_axis(void)   { rgb(0.8, 0.2, 0.9); }
void color_xslice(void) { red(); }
void color_yslice(void) { blue(); }
void ps_axis_color(void)
{
  std::cout << "\n\\newrgbcolor{axis_color}{0.8 0.2 0.9}%";
}

const int MESH(12); // number of coordinate grid squares

// location of tangency point
const double x_0=7.0/MESH;
const double y_0=6.0/MESH;

const double z_0=0.25; // height of top of slicing planes

const int MAX=1; // maximum coordinate

// function to be graphed
P f(double x, double y) { return P(x, y, 0.75*y*(y*y-3*x*x)); }

// constant y slice of the graph of f
P Df_x(double t) { return f(t+x_0, y_0); }

// constant x slice of the graph of f
P Df_y(double t) { return f(x_0, t+y_0); }


int main()
{
  bounding_box(P(-2,-2), P(2,1));
  picture(2,1.5);
  unitlength("1.25in");

  use_pstricks();
  begin();
  viewpoint(VIEWPT);
  use_pstricks(false);

  clip_box(P(-2, -2, -1), P(2, 2, 0.75));

  // front and back halves
  domain R1(P(-1,-1), P(0, 1), mesh(MESH, 2*MESH), mesh(MESH, 2*MESH));
  domain R2(P( 0,-1), P(1, 1), mesh(MESH, 2*MESH), mesh(MESH, 2*MESH));

  // coordinate grids
  color_coord();
  grid(P(-MAX,-MAX,-MAX), P(-MAX, MAX, MAX), MESH, MESH);
  grid(P(-MAX,-MAX,-MAX), P( MAX,-MAX, MAX), MESH, MESH);
  grid(P(-MAX,-MAX,-MAX), P( MAX, MAX,-MAX), MESH, MESH);

  color_axis();

  label(P(0,0.25+MAX,0), P(4,0), "$y$", r);
  label(P(0,0,0.25+MAX), P(0,4), "$z$", t);

  clip();
  fill();
  surface(f, R1);
  fill(false);
  clip(false);

  // coordinate axes
  bold();
  use_pstricks();
  ps_axis_color();
  psset("linecolor=axis_color,fillcolor=axis_color");
  //  color_axis();
  dart(P(0,-MAX,0), P(0,0.25+MAX,0));
  dart(P(0,0,0), P(0,0,0.25+MAX));
  use_pstricks(false);

  // vertices of slicing planes
  P pt1(x_0, 0, z_0), pt2(x_0, 0, -MAX), pt3(x_0, MAX, -MAX);
  P pt4(0, y_0, z_0), pt5(0, y_0, -MAX), pt6(MAX, y_0, -MAX);
  P pt7(x_0, 0, 0), pt8(x_0, MAX, z_0), pt9=f(0,y_0);
  P pt10(MAX, y_0, z_0);

  // lower outlines of slicing planes (partially hidden by surface)
  color_xslice();
  polyline(3, &pt1, &pt2, &pt3).draw();
  color_yslice();
  polyline(3, &pt4, &pt5, &pt6).draw();

  plain();
  clip();
  fill();
  // front 1/2 of surface (x>0)
  surface(f, R2);
  fill(false);
  clip(false);

  // last coordinate axis
  bold();
  use_pstricks();
  psset("linecolor=axis_color, fillcolor=axis_color");
  dart(P(-MAX,0,0), P(0.25+MAX,0,0));
  use_pstricks(false);

  color_axis();
  label(P(0.25+MAX,0,0), P(-2,-2), "$x$", bl);

  font_size("scriptsize");
  // slices of the graph and labels
  pen(1);
  color_yslice();
  plot(Df_x, -x_0, MAX-x_0, 20);
  label(Df_x(MAX-x_0), P(-4,0),
	"$\\displaystyle\\frac{\\partial f}{\\partial x}$: $y$ constant", l);

  clip();
  color_xslice();
  plot(Df_y, -y_0, MAX-y_0, 20);
  clip(false);
  label(Df_y(MAX-y_0), P(4,0),
	"$\\displaystyle\\frac{\\partial f}{\\partial y}$: $x$ constant", br);

  // overall label
  black();
  label(P(-MAX, 0, MAX), P(2,2),
	"$z=\\displaystyle\\frac{1}{2}(y^3-3x^2y)$", tr);

  // fake transparency: redraw slicing planes thinly
  //  clip();
  pen(0.15);
  color_xslice();
  rect(P(x_0, 0, -MAX), P(x_0, 1, z_0));

  color_yslice();
  rect(P(0, y_0, -MAX), P(1, y_0, z_0));

  // upper outlines of slicing planes (not hidden by surface)
  bold();
  color_xslice();
  polyline(4, &pt7, &pt1, &pt8, &pt3).draw();

  color_yslice();
  polyline(4, &pt9, &pt4, &pt10, &pt6).draw();

  end();
}