En cliquant sur une imagette, vous accéderez au source et à l'image. En cliquant sur cette dernière, vous ouvrirez le fichier PDF associé.
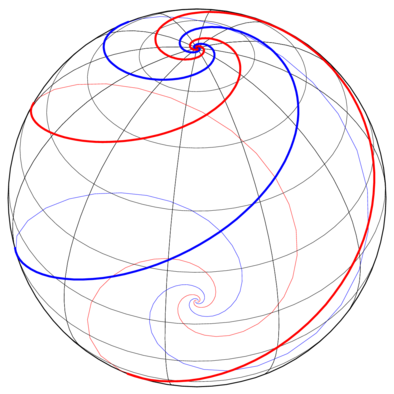
/* -*-ePiX-*- */
/* sphere.xp -- March 28, 2002  */
#include "epix.h"
using namespace ePiX;

const double k = 2*M_PI/(360*sqrt(3)); // assume "degrees" mode
double exp_cos(double t) { return exp(k*t)*Cos(t); }
double exp_sin(double t) { return exp(k*t)*Sin(t); }
double minus_exp_cos(double t) { return -exp_cos(t); }
double minus_exp_sin(double t) { return -exp_sin(t); }

int main()
{
  bounding_box(P(-1,-1), P(1,1));
  picture(160,160);
  unitlength("1pt");
  offset(160, -35);

  begin();
  degrees(); // set angle units
  viewpoint(1, 2.5, 3);

  sphere S1=sphere(); // unit sphere
  S1.draw();

  pen(0.15); // hidden portions of loxodromes
  blue();
  backplot_N(exp_cos, exp_sin, -540, 540, 90);
  backplot_N(minus_exp_cos, minus_exp_sin, -540, 540, 90);
  red();
  backplot_N(exp_sin, minus_exp_cos, -540, 540, 90);
  backplot_N(minus_exp_sin, exp_cos, -540, 540, 90);

  black(); // coordinate grid
  for (int i=0; i<=12; ++i) { latitude(90-15*i,0,360); longitude(30*i,0,360); }

  bold(); // visible portions of loxodromes
  blue();
  frontplot_N(exp_cos, exp_sin, -540, 540, 360);
  frontplot_N(minus_exp_cos, minus_exp_sin, -540, 540, 360);
  red();
  frontplot_N(exp_sin, minus_exp_cos, -540, 540, 360);
  frontplot_N(minus_exp_sin, exp_cos, -540, 540, 360);

  end();
}