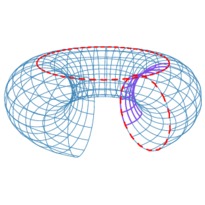
En cliquant sur une imagette, vous accéderez au source et à l'image. En cliquant sur cette dernière, vous ouvrirez le fichier PDF associé.
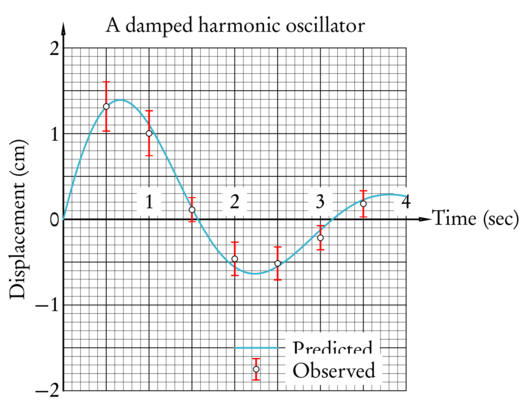
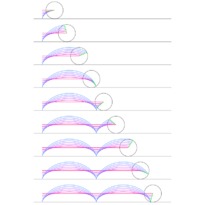
/* -*-ePiX-*- */
#include "epix.h"
using namespace ePiX;

double f(double t, double a) { return 2*exp(-0.5*t)*Sin(a*t); }

// Completely fabricated data
// "Predicted"
inline double f1(double t) { return f(t,2); }
// "Observed"
inline double f2(double t) { return f1(t)+0.1*Cos(3*t); }
//"error"
inline double err(double t) { return 0.125*(1+fabs(f1(t))); }

// Number of error bars
const int samples=8;

void error_bar(P center, double error)
{
  P top    = center + P(0,error);
  P bottom = center - P(0,error);

  line(bottom,top);
  v_axis_tick(top);
  v_axis_tick(bottom);
}

// Half-size of bounding box
const int N=2;

int main()
{
  bounding_box(P(0,-N),P(2*N,N));
  unitlength("1in");
  picture(2.5,2.5);

  begin();

  double x_avg = 0.5*(x_min + x_max);
  // displacement for miscellaneous labels/objects
  const double delta=0.0625*x_size;

  // legend label locations
  P predicted(x_avg + delta, y_min + 2*delta);
  P observed( x_avg + delta, y_min +   delta);

  // graph paper
  grid(N*(int)x_size, N*(int)y_size);
  pen(0.15);
  grid(5*N*(int)x_size,5*N*y_size);

  h_axis_masklabels(P(x_min+1,0), P(x_max,0), x_size-1, P(0,2), t);
  v_axis_labels(P(0,y_min), P(0,y_max), y_size, P(-2, 0), l);

  masklabel(predicted+P(delta), P(4,0), "Predicted", r);
  masklabel(observed+P(delta),  P(4,0), "Observed" , r);

  // axes, names, and labels
  bold();
  dart(P(x_min,0), P(x_max+delta,0));
  dart(P(0,y_min), P(0,y_max+delta));

  label(P(x_max+delta,0), P(2,0), "Time (sec)", r);
  label(P(0,0), P(-18,0), "\\rotateleft{Displacement (cm)}",l);

  // "Predicted" curve
  rgb(0.2, 0.7, 0.8);
  plot(f1, x_min, x_max, 120);

  // legend
  line(predicted-P(delta), predicted+P(delta));

  red();
  // legend
  error_bar(observed, 0.5*delta);

  // "error bars"
  for (int i=1; i < samples; ++i)
    {
      double t=x_min + i*x_size/samples;
      error_bar(P(t, f2(t)), err(t));
    }

  plain();
  // legend
  circ(observed);

  // "data points"; interleaving interferes with color
  for (int i=1; i < samples; ++i)
    {
      double t=x_min + i*x_size/samples;
      circ(P(t,f2(t)));
    }

  // figure title
  black();
  masklabel(P(x_avg, y_max), P(0,2), "A damped harmonic oscillator", t);

  end();
}